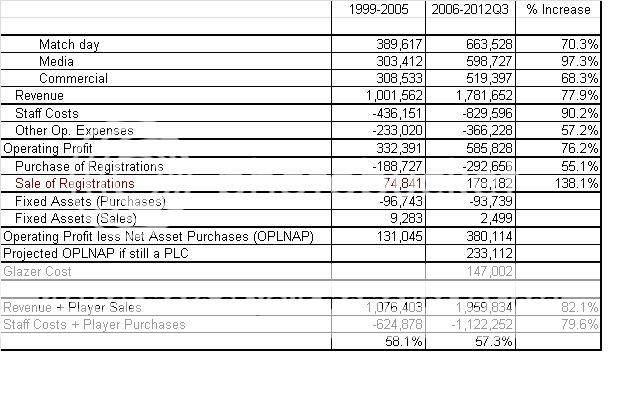
They are pretty but not very informative. Apart from comparing 1998-2005 (8 years) with 2006-2012Q3 (a bit less than 7 years) they present incomplete information and hence only tell a partial story. A more complete set of figures is below for anyone who's interested.
There are two main take-aways: 1) the most the Glazers could have cost us over the period is around £147m, and 2) since the takeover, we've spent almost the same proportion of our total income (Revenue + Player Sales) on total player costs (Staff Costs + Player Purchases) that we did for the seven years before the takeover (around 58%).
The "Glazer cost" is probably an overestimate. There's an implicit assumption that the PLC could have generated identical revenues to those that have actually occurred since the takeover, which is unlikely for a variety of reasons. (There's also an assumption that taxes and dividends would scale in proportion to revenues.) It also doesn't take into account increases in Cash and Marketable Securities (mostly because it's virtually impossible to do using Q3 figures). A little more accuracy in either area would reduce the "cost" markedly. (Note that this is the extra money that might have been available over the period 2006-2012Q3 had there not been a takeover. It says nothing about costs that might arise in the future or imputed costs that have had no cash flow impact on the club (adding those in is how you get up toward the oft quoted £500m figure).
The makeup of "total player costs" has changed somewhat since the takeover, with salaries forming a larger component relative to transfer fees than in the earlier period. When you look at the bigger picture in this way, I think it becomes apparent that "net spend" is a pretty meaningless figure.
Hadn't seen this as a result of the fallout from the IPO new, but as Red-Indian drew my attention to it, I will respond.
[WARNING for others: Really boring shit follows. Move on.]
Pie charts deal with proportions, not absolutes- we do not need to confine ourselves to equal interval comparisons. Reinvestment under the PLC was consistently strong….divestment (dividends and CT) since inception ran (as a percentage of cash profits) ran at 34%. For the last 7 years, the rate was the same. When dealing with absolutes, equal intervals are required as can be inferred from my spiel about Net Spend.
Those charts [not prepared by me, Rood] illustrate “Use of Funds” before and after the takeover, nothing more, nothing less. They are “complete” in that regard.
(Visually, your presentation isn’t a patch on my infographics. Aesthetically, it’s about as appealing as the receipt received after a heavy shop at ASDA. So there!)
As for your claim ("the most Glazers could have cost us over the period is around £147m”): Its delivered with certainty and conviction that but the figure is woefully spurious given the amount of ”ifs, ands and buts” used in its determination.
The reverse cash flow method will only yield correct values if you allow for movement in cash and WC and include all items. The method used to derive your OPLNAP figures is a bit like looking at the aforementioned ASDA receipt and deducing the price paid for turnips by deducting from the total bill the price of anything that isn’t a turnip…… only the method will never deliver the accurate stated cost of turnips because certain items are ignored.
Your value for the 99-2005 "OPLNAP" doesn't square with the actual cash-out in tax and dividends as not all of the 1999-2005 "OPLNAP" was siphoned off in dividends and tax. The actual combined figure for tax and dividends paid during that period is 105m. (I don't understand why you would even consider using an estimate for a known actual in your projection). Using my “pretty but not very informative” graphic together with your estimate of operating profit would give an estimated cash-out of 112m- higher than the actual, but certainly not as inaccurate as your 131m. Rolling the actual figure forward at the chosen rate gives a projected "OPLNAP" of 186m.
The fact that your projected "OPLNAP" OF 233M mirrors your estimate from recasting the financial statements is quirky and probably an interesting example of confirmation bias at work.
A correct working for the other period gives an "OPLNAP" for the 2006-2012 period of about 410m, producing a revised Glazer cost of about 225m- a significant increase on your estimate.
As your previous explict approach will reveal, that isn't the last word on Glazer costs; certain items above the profit line do not feature in your new approach. Perhaps, you should have mentioned this with your other ”ifs, ands and buts”.
If by "Marketable securities" you are referring to the bond then the IPO prospectus is pretty clear.

